Welcome! This website accompanies our publication 'Nova regulates brain-specific splicing to shape the synapse. (2005), Ule et al.' It presents the data from Affymetrix custom splicing microarray analysis of brain and immune tissues in wildtype and Nova-2-/- and Nova-1-/- mice. The graphical presentation of data integrates information alternative splicing and steady state levels in order to enable comparison of different modes of gene expression regulation (Raw data charts). In addition to individual gene search, genes can be sorted by largest splicing or steady state difference between two samples (Comparative data). Functional groups of regulated genes can be retrieved by sorting the significance of over-representation in different data sets (Functional analysis). Finally, network analysis shows that Nova-2 regulated genes encode a module of functionally interconnected synaptic proteins (Nova-2 regulated network).
Recommended Browser:
We recommend Internet Explorer, because we find that from this browser, the user can copy and paste tab-delimited data into
applications such as Excell.
Legend:
Eex     Exon-skipping isoform
Ein     Exon-including isoform
N1      Nova-1
N2      Nova-2
/       this sign denotes comparison (e. g.: wt/ko)
wt      wild-type
ko      knockout
cx      neocortex
cb      cerebellum
mb      midbrain
sc      spinal cord
thy     thymus
spl     spleen
cx N2 low filter   For N2 wt/ko cx, we ran one comparison using
lower filtering criteria than normal, which helped us identify
a few additional Nova-2 targets.
Nomenclature:
-
Eex is the exon junction that skips the alternative exon, testing the isoform that excludes the exon. It is always named as Ey-Ez,
where y is the number of the upstream exon, and z the number of the downstream exon.
- Ein is the alternative exon, or exon junction that contacts the alternative exon, testing the isoform that includes
the exon. It is named as Ey-Ew, Ew-Ez or Ew, where w is the number of the alternative exon (y the number of the upstream exon,
and z the number of the downstream exon).
- mm3 release of mouse genome contains 17713 annotated genes. 4280 of our isoforms fall within the annotated genes. The exon
number (n) for these isoforms (En) corresponds to the exon number on the representative mRNAs in the mm3 genome.
-
If an exon from the array falls between two exons of a representative RNA (which is often the case for alternative exons), the
letter a is added AFTER the number, e. g. Ena (where n is the number of the upstream exon on a representative mRNA).
-
420 exons that were tested on the array are not within annotated genes of mm3 genome - therefore, we kept Affymetrix numbering
for these exons. In these cases, the exon names include letter a BEFORE the number, e. g. Ean, where x is the number
of 'genomic exon' These numbers need to be considered with caution, as they most often do not correspond to exon number on
any individual RNA -most often they are much higher.
-
The sequences of the exons that are contacted by the corresponding probesets are given. For example, sequence for Ey-Ez
would contain sequence of the upstream and downstream exon next to each other, whereas sequence for Ew would contain sequence
of the alternative exon.
-
Gene symbol, locus ID and Refseq ID were defined based on the mm3 public release of mouse genome. Gene description
and ontology was defined using the EASE program from NCBI.
Description of the primary web pages:
- Search Gene:
Start by searching by Gene Symbol, Locus ID, Refseq ID, gene Description or gene Ontology (GO).
The results take you to gene details.
- Raw Data:
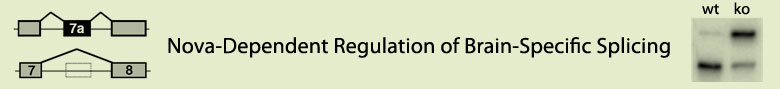
PCR gel:For those alternative exons that have been tested by RT-PCR,
you can view RT-PCR data (gel picture + graphical depiction of isoforms + quantitation graphs).
Chart:For about 700 alternative exons (those
showing highest splicing differences, and belong to genes with defined ontology) the raw data is drawn in graphical format.
Table:For all genes and alternative exons, numerical raw data can be accessed.
- Tissue Specificity:
This page contains all the genes that were used as the input to the GoMiner analysis of molecular functions, the results of which are shown in Table 2 and Figure 4. For instance, it includes the 591 exons with differential splicing between brain and immune tissues - the ΔI values shown are the average values for comparison of different brain regions with either spleen or thymus.
- Comparative Data:
Start with the comparative data of all the 4776 tested isoforms. The data can be sorted, and the isoforms with highest differences will be at the top (positive changes) and at the bottom (negative changes). From here, genes of interest can be chosen, which takes you to page gene details.
- Functional Analysis:
These data were generated by the Gominer program.
- Choose whether you want to see the results for groups of genes that showed large changes either in:(a) alternative splicing;
(b) steady state; (c) both.
- The results are shown both as the numbers of genes in each category, and as p-values of over-representation. These can be sorted to find the ontologies with most significant number of genes.
- Click on the gene ontology of your interest. This will take you to comparative data for genes in that gene category that showed changes in at least one sample comparison.
- Sort the data for these genes and choose the gene of your interest, which takes you to gene details.
- Nova-2 Regulated Network:
The network was generated using Pathway Assist program, showing network analysis of Nova-regulated genes. The symbols of genes that contain validated Nova-regulated exons identified by microarray are in light red, and those identified by previoius studies are in green. The genes that contained multiple CLIP tags are in blue, and the other genes that constitute the same network, but are not known to be regulated by Nova, are in white. Purple circple in the connection denotes direct interaction, and triangle denotes any form of regulation. Each connection is based on a published reference, which can be accessed by clicking onto the circle or triangle (most connections were verified manually). The detailed description of the genes can be accessed by clicking onto the gene symbols.
Description of the intermediate web pages:
- Gene Details:
See details (gene name, ontology, Locus ID�) - from here can either go to comparative data, raw data or alternative isoform sequences with links to data charts with RT-PCR gel pictures. (if you click the Exon Sequences link).
- Comparative Data:
See comparative data for the chosen genes. These data show the difference between two samples, and are used to sort the exons/genes and find the ones with highest differences. From here, a gene of interest can be chosen, which takes you to gene details for that gene.
(a) Select a feature: enables you to choose what data will be shown:
Change in fraction of exon inclusion (ΔI, splicing):
positive value represents the increase of exon inclusion in the first sample relative to the second - a negative value represents a decrease in the first sample.
Fold change in the ratio of alternative isoforms (splicing):
a value higher than 1 represents the fold increase of the exon-included isoform relative to the exon-skipped isoform in the first sample
relative to the second - a value lower than 1 represents fold decrease in the first sample.
Steady state level change (transcription + RNA degradation):
a value higher than 1 represents the fold increase of the steady state (of all transcripts of a particular gene) in the first sample relative to the second - a value lower than 1 represents the fold decrease in the first sample.
(b) Select sample comparisons: because too many comparisons have been made to be shown in a single page, the data is divided into three parts, and only the selected comparisons are shown at one time:
Representative comparisons shows both RT-PCR & microarray comparative data for wildtype/knockout comparisons in three different tissues, and comparisons between these three tissues.
Nova wild-type and knockout shows microarray comparative data for 4 Nova-1 and 6 Nova-2 tissues where wildtype vs. knockout comparison has been done (on top of each column is shown the tissue where wt/ko comparison has been made)
Comparisons between tissues shows microarray comparative data between different wild-type tissues.
- Exon Sequences:
Here you see information of alternative isoforms (exon numbers, nucleotide sequence, coding region�). This page also contains links to data charts with RT-PCR gel pictures and a link to the BLAT website, where you can identify the isoforms in the mouse genome by copy/pasting the Eex or Ein sequence.
Contact:
Contact Dr. Jernej Ule at ulej@rockefeller.edu with suggestions and comments.
|